Harvard dental students built CHOMP, an open-source map of Medicaid dental claims that makes state-by-state gaps in oral care easy to see.
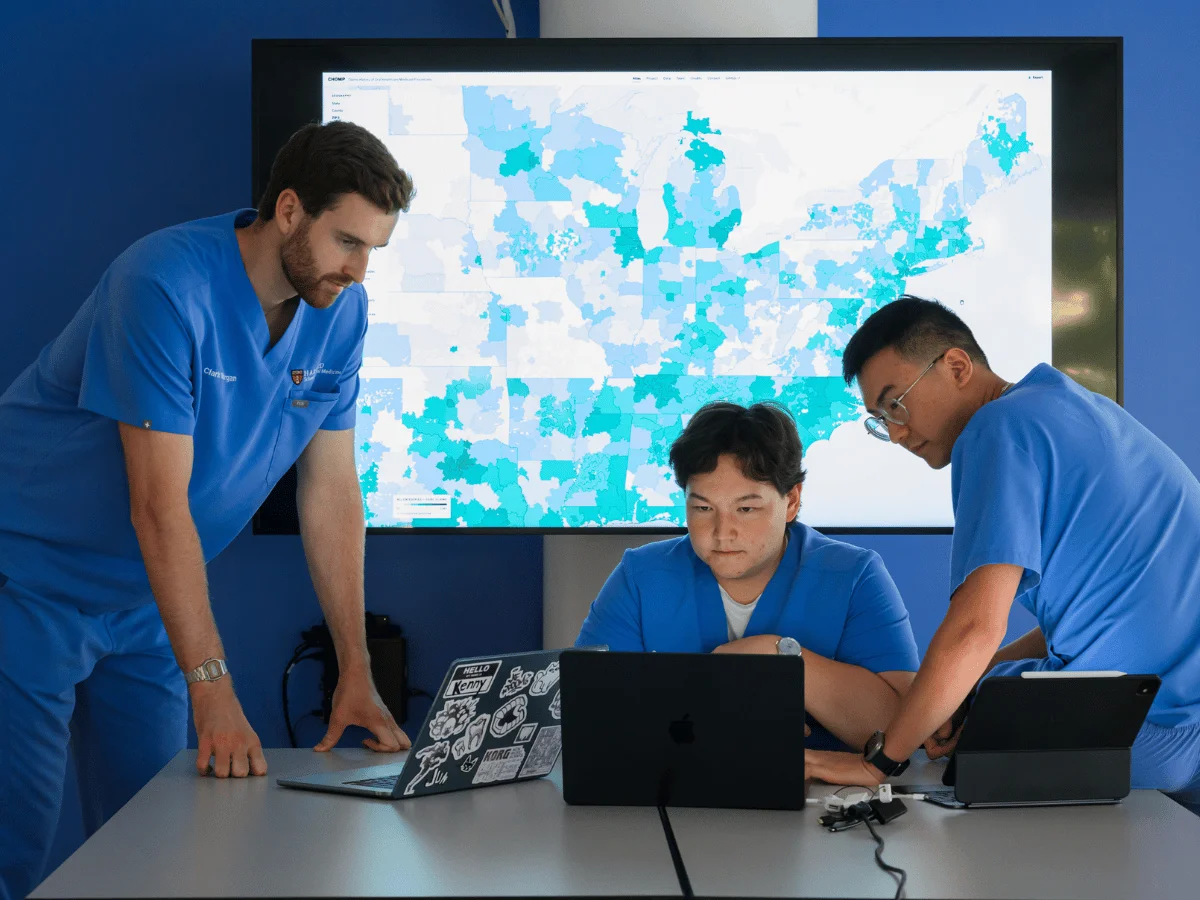
Federal health data usually sits in a format that few people can use without a lot of spreadsheet work. The Department of Health and Human Services put a large Medicaid claims dataset online in February 2026, covering 2018 through 2024. The stated goal was to help spot fraud. Three third-year students at the Harvard School of Dental Medicine saw something else in it: a clear picture of who gets dental care, and who doesn't.
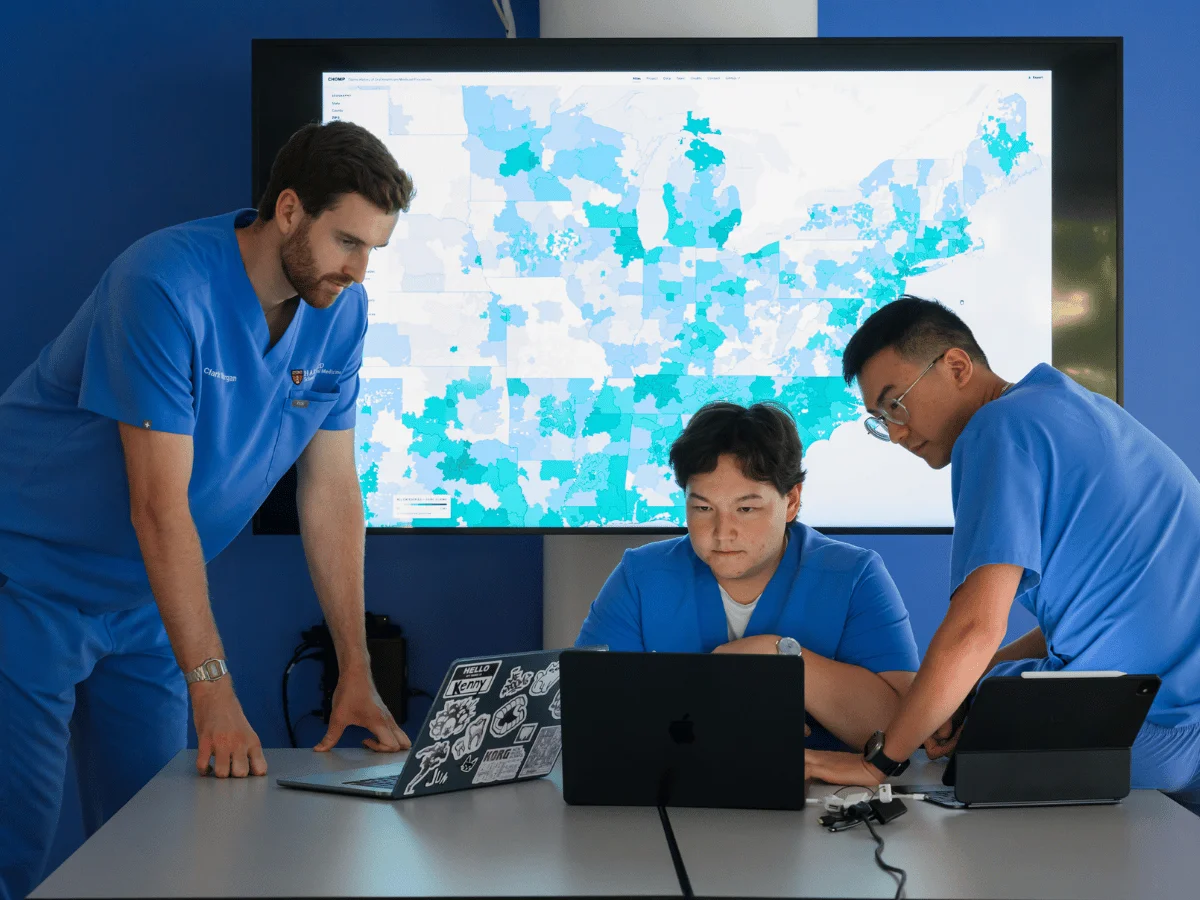
Clark Morgan (left), Samat Borbiev, and Kenny Liu.
Photo by Gretchen Ertl
From 227 million rows to a usable map
Clark Morgan, Kenny Liu, and Samat Borbiev, all D.M.D. candidates in the class of 2028, built the project around a simple premise. Dental claims were buried in the federal release, and nobody was going to pull them out for researchers without a lot of effort. Morgan put the value plainly: the dataset would normally cost thousands of dollars to access and work with, and the team wanted to turn it into a public tool for researchers and policymakers.
The tool is called CHOMP, short for Claims History of Oral Healthcare Medicaid Procedures. It maps dental procedures covered by Medicaid across the country. The team started with 227 million rows of raw claims, and the early weeks were mostly exploration. "There were a couple weeks where we were just playing around with tons of data," Liu said. The biggest surprise came when they realized the file contained dental procedure codes. Those codes made the rest of the project possible.
With procedure codes in hand, the students could sort Medicaid activity by diagnostic, preventive, and restorative care, along with dental specialty. That's useful, but raw codes still don't tell you where anything happened. Claims alone couldn't answer that question, so the team had to bring in provider data.
Merging the datasets
Liu described the finished product as a merge of several sources rather than a single dataset. The students pulled in the National Plan and Provider Enumeration System, a federal provider registry, and used it to link claims to geography. They based the location on the first three digits of each provider's ZIP code. Without that step, Liu said, the initial federal release would have been a serious barrier for most people trying to use it.
Liu then brought in friends with computer science backgrounds to help write the code and convert the working dataset into a geographic information system visualization. The students had the skills to clean and organize the data, but they needed help to make the map interactive and fast enough for ordinary users.
The project gained real research weight when the team reached out to Hawazin Elani, an associate professor of oral health policy and epidemiology at the Dental School. Elani works on large-scale data analytics and health policy research, and she helped the students think through how the tool would hold up under scrutiny from researchers.
Making the tool work for researchers
Elani's team pushed CHOMP beyond a student project. They added county-level measures for more precise geographic detail and linked the Medicaid claims to other national datasets, which gives researchers more context for what they're seeing. They also designed the interface around how researchers actually work: navigating the data, filtering it, comparing groups, and interpreting results. Elani's group connected the students with additional Harvard resources to finish building the site.
The result lets users explore Medicaid dental care by year, procedure, specialty, geography, reimbursement, and other contextual characteristics. That combination of filters is what separates CHOMP from a static chart. A user can ask a narrow question, such as how orthodontic claims differ between two neighboring states, and get an answer in a few clicks.
Elani was blunt about what the students pulled off. "They had taken an enormous, difficult-to-use federal dataset and created a way to see patterns in dental care that would otherwise remain buried in millions of claims," she said. Her point was about connection as much as scale. Once the claims can be explored geographically and set next to other national data, researchers can compare communities and states and spot policy questions that would be hard to notice in raw files.
Where the disparities show up
Once the claims were plotted on a map, the differences jumped out in a way they never did in a spreadsheet. The students were struck by how much Medicaid reimbursement varied from state to state. Some states covered different populations, and some covered different procedures altogether.
Morgan's reaction was personal. "I am upset by the fact that the difference in care provided between states can be so drastic," he said. He pulled up the specialty of orthodontics on the map and clicked through the claims state by state. Some states showed none at all.
He kept coming back to the people living near state lines. "I think of the person who lives right on the other side of the state line who can't access that care. They're just as deserving, but they can't get care because of differing criteria in their state," he said. Morgan added that CHOMP could help researchers study the long-term effects of differences in dental coverage and use. That's a question that's hard to answer with anecdotes and easy to get wrong with incomplete data.
Borbiev pointed to the same kind of comparison. "Using CHOMP, you can see the treatments that are offered, and you can see very clearly, 'Oh, this state seems to be doing quite well in these areas of care and this state is not,'" he said. The students don't see the tool as the final word on why those gaps exist. They see it as a way to start the conversation about why care differs from one state to the next.
Built for policymakers, and open to others
The students are aiming CHOMP at policymakers, who often don't have time to parse millions of claims. Borbiev said the nuances are hard to grasp without a visual. "If you're a policymaker, it can be hard to understand all the nuances of the data without this visualization," he said. "But because our map is so visual, it's easy to tell a story with these pictures."
The students released CHOMP as an open-source tool, which means others can build on it. Morgan framed the current site as a first step. "Our intention is for this site to be sort of the first iteration of a larger project," he said. He hopes the tool, and the framework behind it for organizing the data, will help policymakers, providers, researchers, and anyone else interested in improving oral and systemic health. He also wants the data turned into insights that work at the local, state, and national level.
The bigger takeaway here is that a public dataset isn't useful until someone makes it legible. The HHS release was technically open, but the work of merging provider records, adding geography, and designing for real users is what turned it into something a researcher could use. That gap between "available" and "usable" is where a lot of public health data sits, and it's where a project like this can matter most.
Thinking beyond the operatory
All three students plan to pursue oral surgery after graduation. Building CHOMP, though, widened their view of what shapes the care a patient can actually get. Coverage rules, state criteria, and provider access all sit outside the treatment room, and they affect who ends up in the chair.
Liu drew that connection directly. "Beyond your professional expertise, you have all these external factors that impact the treatment you can provide. I believe very strongly that you should advocate for your patients. And to me, this is a form of patient advocacy," he said.



Discussion
Sign in to join the discussion.